
Regular riders develop a special intuition about streets: if they look fast they will be risky.
You find that certain streets—even though the speed limit might be low and there might be schools and people about——will inevitably feature fast and careless driving.
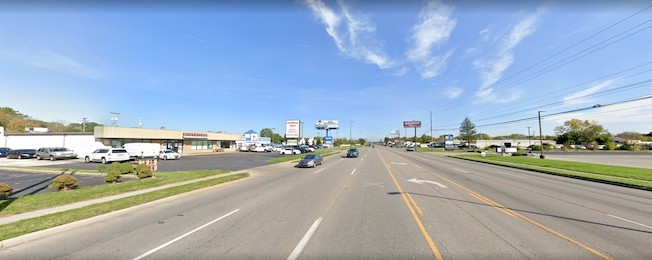
With these streets the first thing you notice is that they are long and straight; and often really wide. They feel so open you could be on a highway.
Perhaps drivers, feeling comfortable and relaxed, put the foot down as if they were on a highway?
A new study using novel methods suggest that this is exactly what happens: the ‘open road' look results in higher speeds and more crashes.
Ohio State University researchers applied machine learning techniques to analyse more than 240,000 images of road segments taken from Google Street View.
The goal was to see what the roads looked like to drivers and whether that was linked to serious and deadly crashes.
Findings showed street segments that were classified as "open roads" -- those where the photos showed more visible sky, more roadway and more signs -- had 48% more crashes that caused injury or death than those classified as "open residential."
"There are a lot of roads in urban areas that aren't highways but look like high-speed highways from the driver's point of view," said Jonathan Stiles, now at Florida Atlantic University, who led this work as a postdoctoral researcher in geography at Ohio State.
"That's a problem because drivers behave as if those streets are highways, even though there may be a lot of pedestrians and human activity nearby."
These dangerous "open roads" are familiar to anyone who has driven through urban areas, said Harvey Miller, who is director of Ohio State's Center for Urban and Regional Analysis.
"They generally have multiple lanes of traffic, lots of road signs and few trees, and are lined with strip malls, big-box stores, gas stations and restaurants.
"To drivers, the road appears safe for driving at high speeds. We're combining a lot of complexity and human activity with the desire to move cars as quickly as possible. It is a dangerous combination," Miller said.
After collecting the 241,179 street view images of road segments in Columbus, the researchers used a machine learning model to segment each photo into visual objects. The model was able to tell how much of each photo showed sky, roadway, signs, buildings, trees and other objects. Sky was the most common element of the photos, covering 27.8% of the images, followed by road (24.6%) and trees (17.9%).
A computer "cluster analysis" identified four types of streets in Columbus, Ohio, from the photos. "Leafy residential" had more trees and narrower roads, while "open residential" had comparatively more sky and road alongside houses.
"Built-up urban" described areas like downtown, with relatively more buildings, sidewalks and cars. "Open road" had more sky, roadway and signage relative to other road types.
The researchers then looked at crash data for each of these road segments from 2018 and 2019. They examined only the 7,359 crashes that resulted in injuries or fatalities.
The study compared the number of serious crashes in three of the road categories to those on open residential roads, which was treated as the reference group.
The leafy residential group had 12.4% fewer crashes than open residential, while the built-up urban had 21.7% more serious and fatal crashes.
But it was the open road cluster than had the highest correlation with serious and fatal crashes, with 48% more than the open residential.
Miller emphasized that this association between serious crashes and road type was found even after taking into account a variety of other factors that can affect the number of crashes, including official state road designations for each segment that are related to speed limits and traffic volume.
The findings in this study support the theory of self-explaining roads, which suggests drivers' expectations and behaviours are shaped by road design features, Miller said.
"The idea is that people don't really pay attention to the posted speed limits. What they do is pay attention to how fast the road is telling them it is safe to drive," he said.
"Our results suggest that many urban roads tell people it is safe to drive fast when it really is not -- and the result is more serious and fatal crashes."
An important implication of the findings is that traffic engineers need to rethink how they design urban roads, the authors said.
"We're thinking about urban roads wrong in some ways," Stiles said. "We are encouraging people to drive fast in areas with a lot of people and complexity."
One solution would be to narrow some of the more dangerous roadways with bike lanes, while adding more nearby greenery, buildings and sidewalks.
"A loss of vehicle capacity and speeds on such roads may be concerning to some, but this should be weighed against the numerous injuries and deaths these roads lead to in busy areas," Miller said.
You can read the study abstract here.
This article was made possible by the support of Bicycle Network's members who enable us to make bike riding better in Australia.
Become our friend
Find out more about Bicycle Network and support us in making it easier for people to ride bikes.