
As climate change impacts move into mainstream conversation across the nation, the ugly truth has emerged that CO2 emissions from the transport sector are not coming down as expected.
And its all our fault.
When we go to purchase a new vehicle, instead of getting lowest emission vehicle in its class, we are choosing vehicles that on average pump out 60 percent more CO2.
Then we go out and moan about drought, floods and the destruction of the Great Barrier Reef.
The NTC annually reviews emissions intensity of new vehicles, measuring in terms of grams of carbon dioxide per kilometre (g/km).
This is a measure of vehicle efficiency or intensity rather than a measure of actual vehicle emissions, which depends on many factors such as distance travelled, the nature of the driving and road and traffic conditions.
In 2018 the national average carbon dioxide emissions intensity from new passenger and light commercial vehicles was 180.9 g/km. This is a 0.4 per cent improvement from 2017.
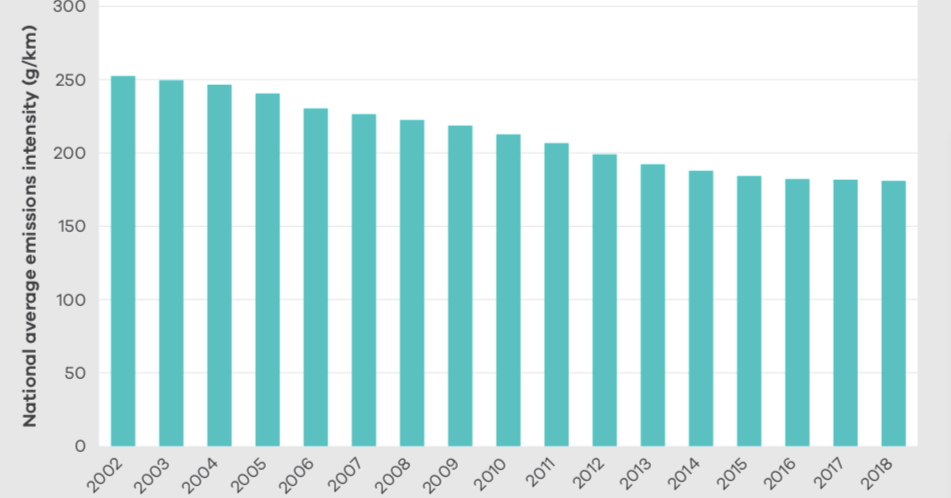
This is the second lowest annual improvement since records started in 2002.
The NTC reports that consumer preferences are an important factor affecting the national average of carbon dioxide emissions intensity for new vehicles.
If all Australians who purchased new vehicles in 2018 had purchased vehicles with best-in-class emissions, the national average carbon dioxide emissions intensity would have been reduced to 73 g/km, a 60 per cent reduction.
About 91 per cent of all new vehicle sales in 2018 were from 15 makes. Of these 15 makes, Audi had the lowest corporate average emissions intensity (148 g/km), and Ford had the highest (216 g/km).
Private buyers purchased vehicles with the lowest average emissions intensity (174 g/km) in 2018, followed by business buyers (186 g/km) and government buyers (195 g/km).
In Europe the average emissions intensity for new passenger vehicles on the market is almost half that of Australia.
Among the reasons why Australian light vehicle emissions intensity are higher than in Europe include:
- Australian consumer preferences for heavier vehicles with larger and more powerful engines
- Australia has a lower proportion of diesel-powered engines
- Australia has fewer government incentives for lower emissions vehicles
- Relatively lower fuel prices in Australia compared with Europe
There were 93 ‘green’ car model variants available in Australia in 2018 (compared with 97 in 2017), which represented 4.1 per cent of total sales (compared with 3.8 per cent in 2017). A ‘green’ car is defined as a vehicle with emissions intensity that does not exceed 120 g/km.
The number of electric vehicles sold in 2018 was just 2,357.
We suggest it is time that the NTC adds e-bikes to its assessments.
If international trends are any guide, many people are more likely to opt for the convenience and comparatively low cost of an e-bike than pony up for an electric car.
See the NTC's Carbon Dioxide Emissions Intensity for New Australian Light Vehicles 2018
See the C02 emissions infographic here

Become our friend
Find out more about Bicycle Network and support us in making it easier for people to ride bikes.